Visible
Analysis & Data Products
Our visible analysis algorithms use modern techniques and the latest camera technologies to deliver data products unparalleled in all-sky imaging systems.
Sky Cover Percentage
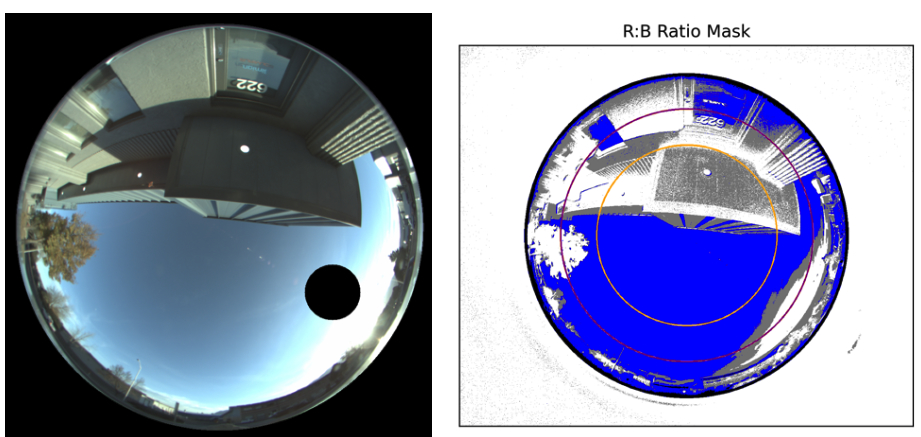
Sky cover is computed in two user-defined fields of view (typically 100° and 160°). Three categories are defined by user-configured thresholds applied to processed Red/Blue (R/B) and Green/Blue (G/B) ratio images:
A parameterization of the clear-sky R/B and G/B ratios as a function of airmass is subtracted from the raw ratio images. A secondary subtraction removes the sun's R/B and G/B contribution as a function of angular distance from the sun. Sky cover thresholds are then applied to these processed images.
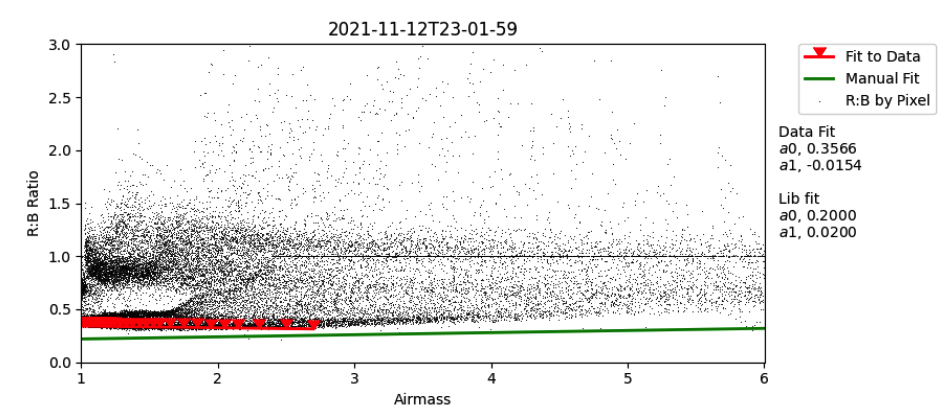
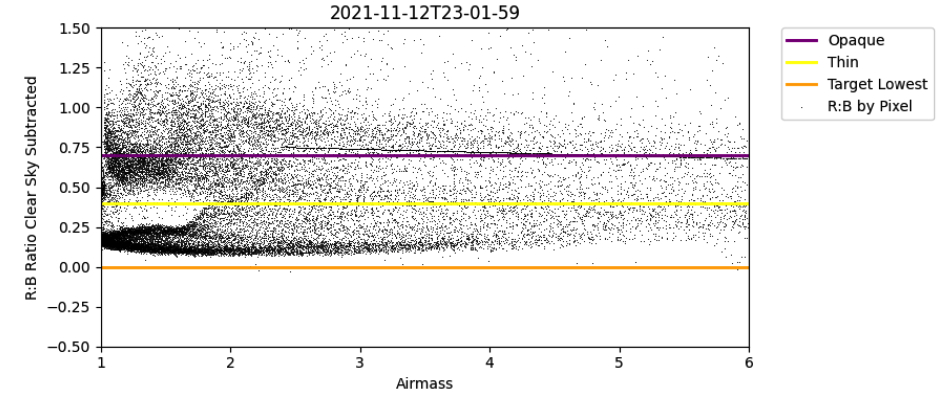
Airmass Diagnostic Plots
R/B and G/B ratio data plotted as a function of airmass are used to assess the quality of selected clear-sky parameters. On-the-fly parameterization of these data assists in refining clear-sky parameter selection.
Additional Analysis Capabilities
☀️ Diagnostic Sun Profile Plots
R/B and G/B ratio data plotted as a function of pixel distance from the sun. This analysis improves cloud/no-cloud detection and informs selection of the sun exclusion mask in the vicinity of the sun.
⏱️ Exposure Time Monitoring
Enables conversion of all RGB channel data to instrumental (uncalibrated) intensity. Combined with ancillary calibration data, this supports additional data products such as downwelling radiance and atmospheric visibility.