
Infrared
Analysis & Data Products
Our industry-leading infrared analysis software provides data products and measurements second to none. We work closely with our customers to provide complete understanding of our analysis and how it applies to their application domain. In addition to our standard data products below, we can work with you to develop a data set that best meets your requirements.
Live Data Demonstrations
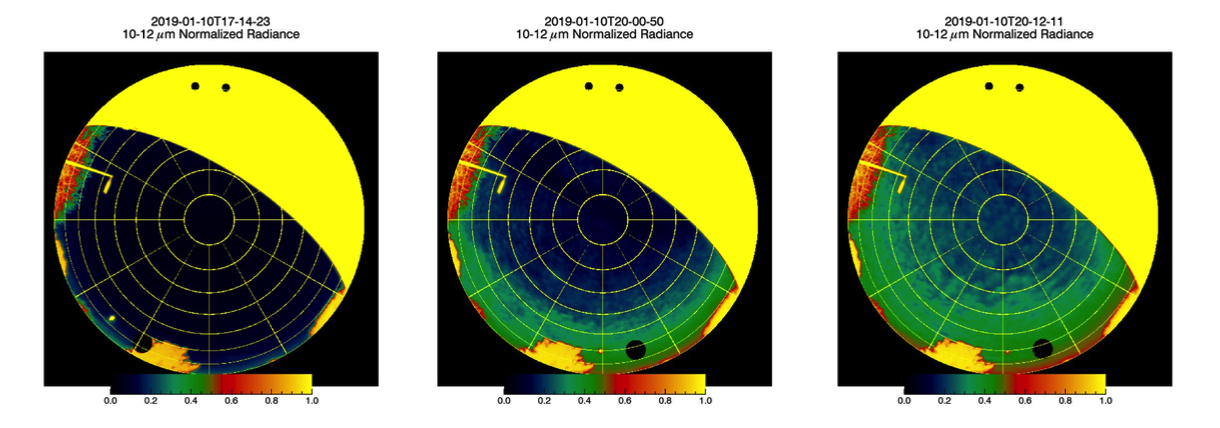
Spectral Radiance (SR) & Normalized Spectral Radiance (NR)
Spectral radiance (SR) is given in units of W/m²/µm/strd and computed over the bandpass of the filter. Temperature data from the dual external blackbody and instrument response data derived from the blackbody calibration procedure are used in determining SR.
Normalized spectral radiance (NR) is the calibrated SR divided by the spectral blackbody radiance derived from ambient temperature. SR and NR are the primary data products that form the basis of all other data products.
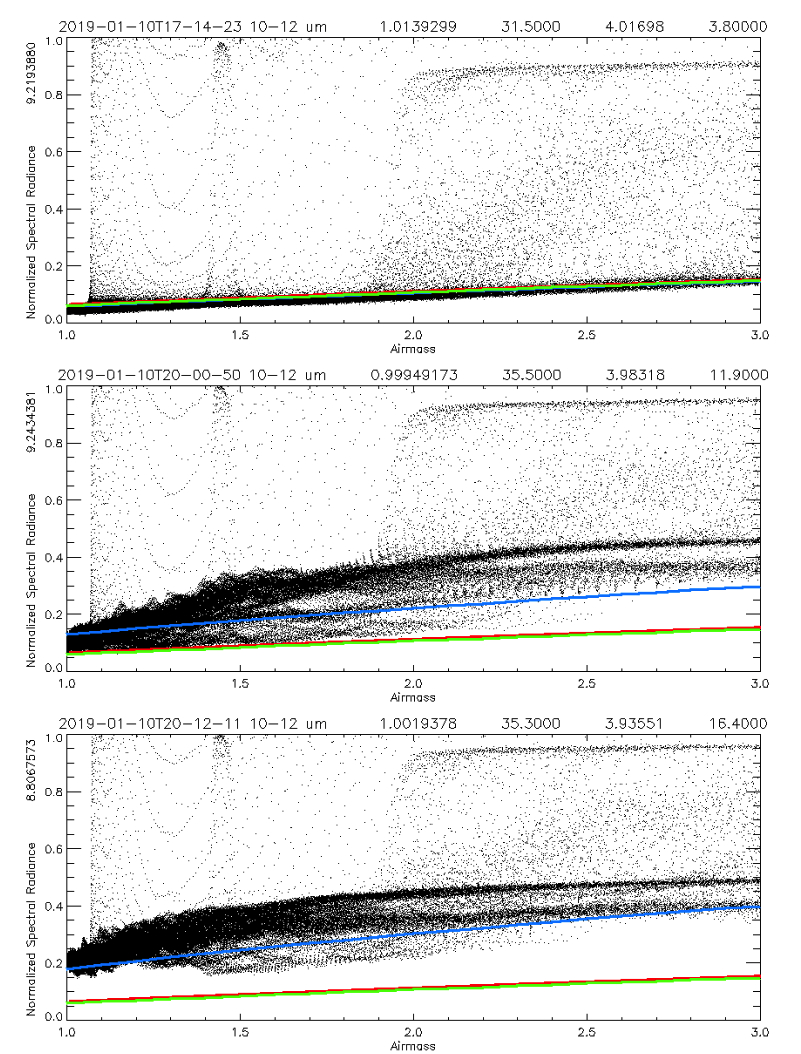
Airmass Plots (AM)
The AM data product displays the relation of NR for each pixel as a function of airmass. These data are analyzed to determine the clear sky normalized radiance for each pixel. Solmirus continues to perfect its algorithm in determining the clear sky normalized radiance — including analyzing AM plots from previous acquisition sequences to inform the best possible solution for a specific image.
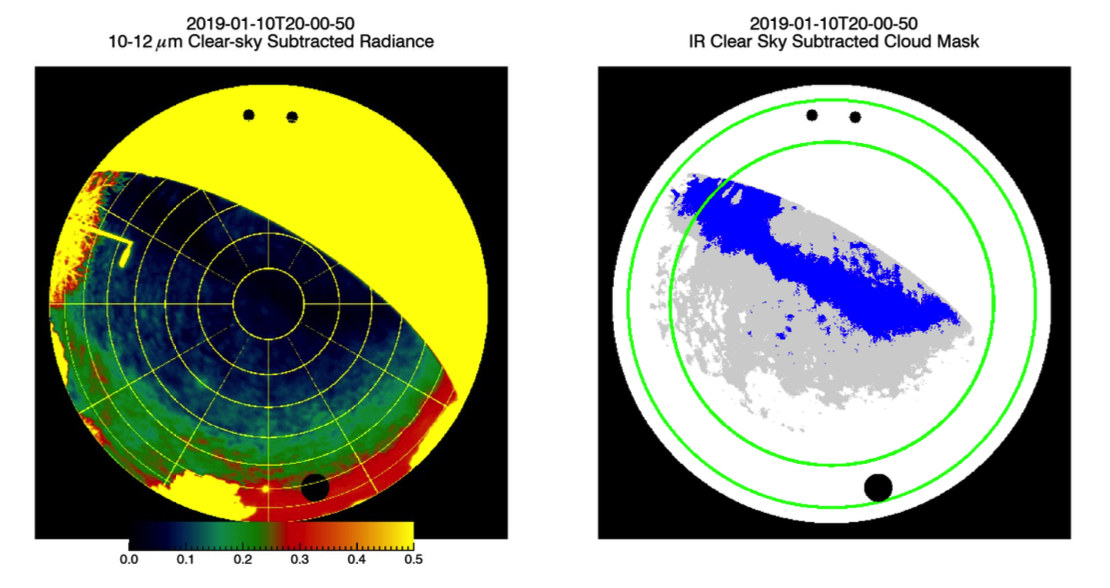
Clear Sky Subtraction & Cloud Mask
CS_SUB represents the difference of the NR image and the clear sky radiance derived from NR vs AM analysis. This separates cloud emission from clear sky emission and drives sky cover analysis.
Cloud Mask (CS_SUB_MASK) applies thresholds to CS_SUB data to produce cloud mask imagery — typically displaying low emission (LE) and high emission (HE) clouds.
Sky cover values (%) are computed in two user-defined fields of view (typically 100° and 160°) and recorded in the FITS header.
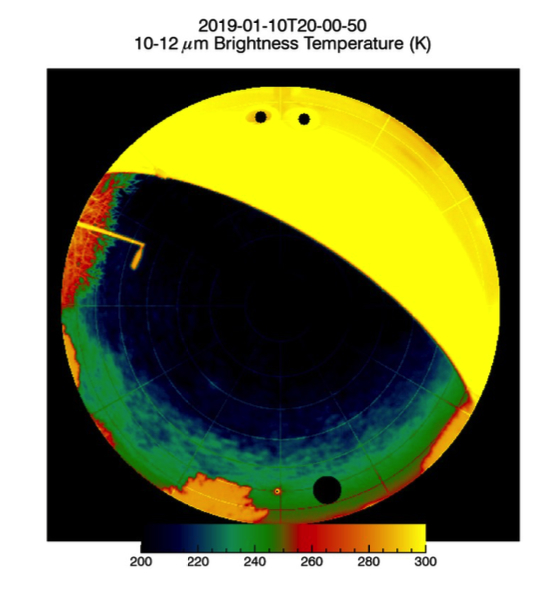
Brightness Temperature (BT) & Color Temperature (CT)
BT is determined by equating the measured spectral radiance with a blackbody whose temperature yields that same radiance. CT is inferred by taking the ratio of spectral radiance from two filters and equating this to a blackbody at the temperature yielding that same ratio.
BT and CT are given per pixel across ASIS's field of view. A subset reports median BT and CT at the zenith in the FITS header. Combined with lapse rate data from the operational site, BT and CT can be used to determine Cloud Base Height (CBH).
Note: BT data is only accurate in determining CBH in cases where the cloud is optically thick.
Notable Characteristics
IR Image Coadding
Coadding capabilities for improved signal-to-noise ratio — enhancing detection of faint cloud structure and improving measurement precision.
Multi-Filter Analysis
Customizable multi-filter analysis grants flexibility across wavelengths, enabling exploration of differing wavelength-dependent atmospheric characteristics.
Real-Time Cadence
Small cadence time supports close to real-time reporting — enabling responsive operational decision-making and telescope automation.
16-Bit HDR Imagery
High-resolution 16-bit image production — delivering the full radiometric depth needed for detailed scientific analysis and post-processing.